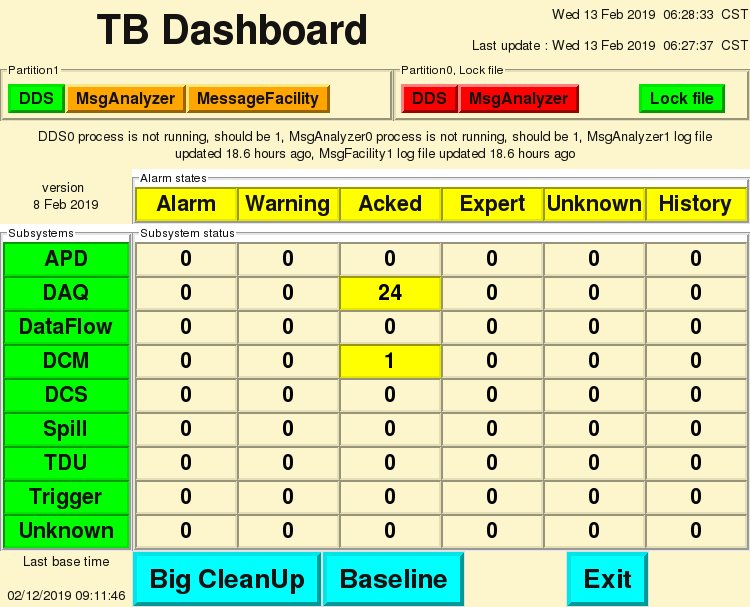
Dashboard Dashboard
Dashboard is an online Python GUI tool displaying current problems of NOvA DAQ system
for all (Far, Near and Testbeam) detectors. Status information is collected from nearly
all systems and displayed in a single window (separate for each detector) for easy and
quick review by the shifter. DAQ status information formerly spread over many windows
on several screens is gathered in a single window.
- collects status data for most DAQ systems
- provides details about affected DAQ component and type of detected error
- monitors some important processes and their log files
- sends warning email to experts when alarm arrives
|
 |
Downtime logger
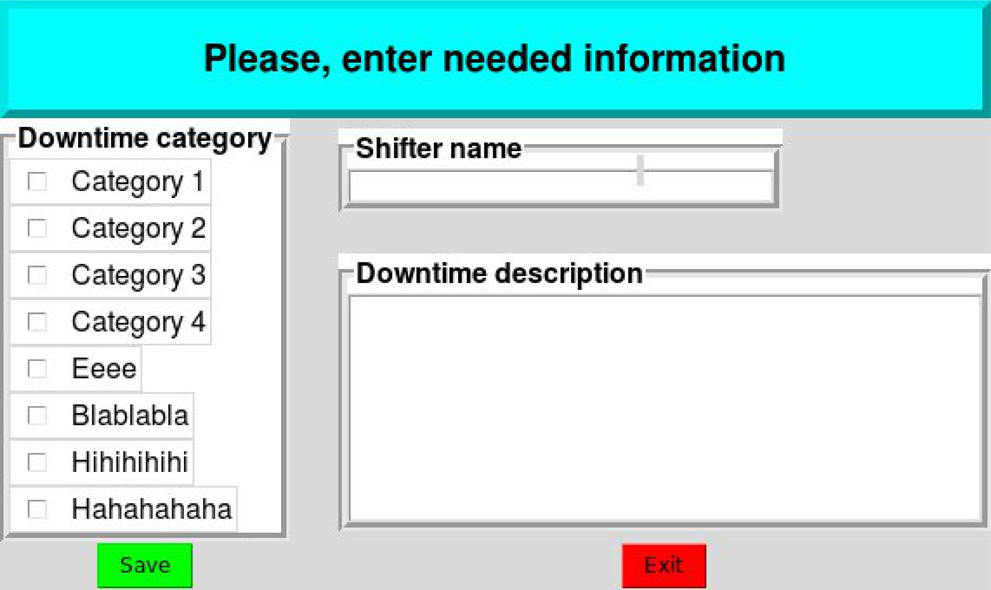
Downtime logger is a Python GUI tool which saves information about NOvA detectors downtime to database for later analysis. The tool also gives user the possibility to create new downtime records or list and edit already existing records.
- automatically saves downtime start and end times, run number to database
- asks shifter for additional downtime information
- posts downtime info to ECL
- sends warning email to experts
|
 |
Devcheck
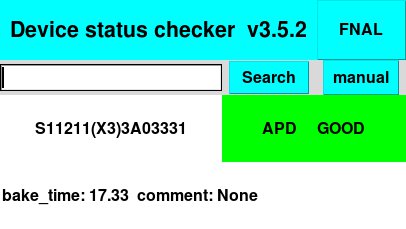
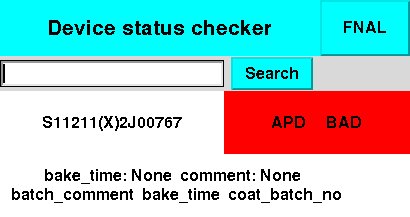
Devcheck is a Python based GUI tool which displays status of device with given serial number. Tool checks device test data stored in hardware database and based on test data requirements makes a decision whether it is ready for installation.
- accepts either manually written bar code or input from bar code scanner
- checks given device test results
- quickly provides yes/no answer whether checked device is ready for installation
|
 |
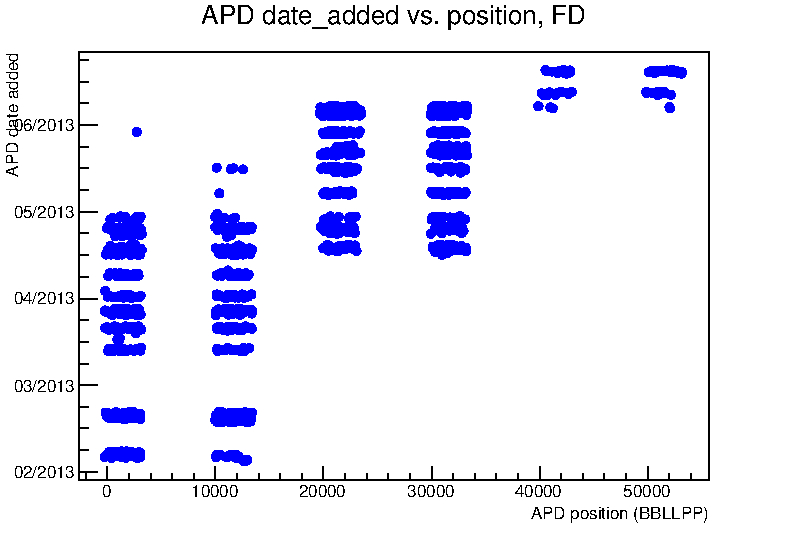
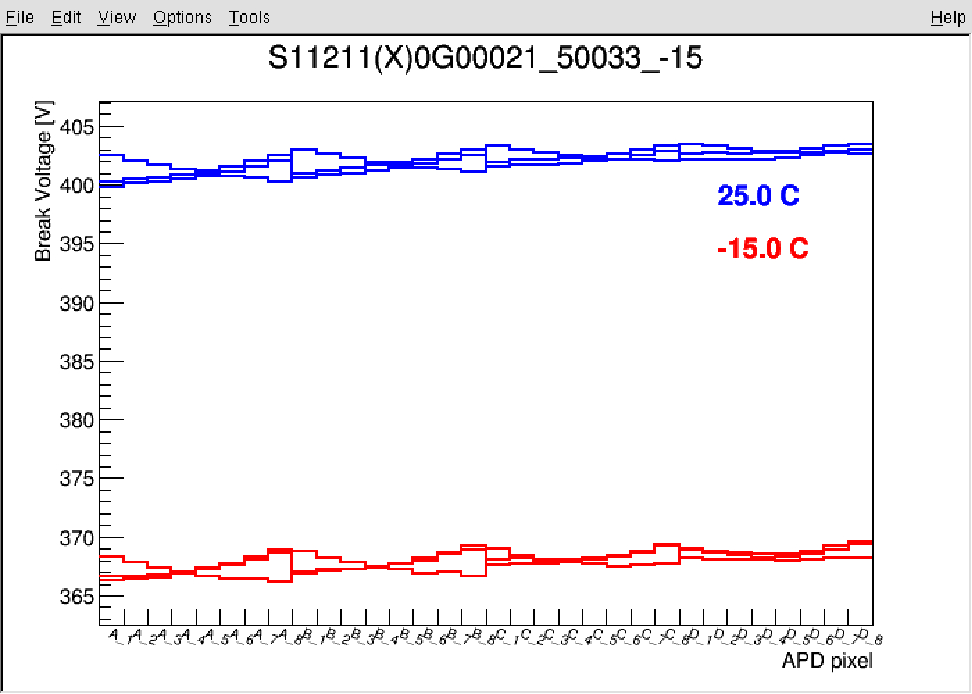
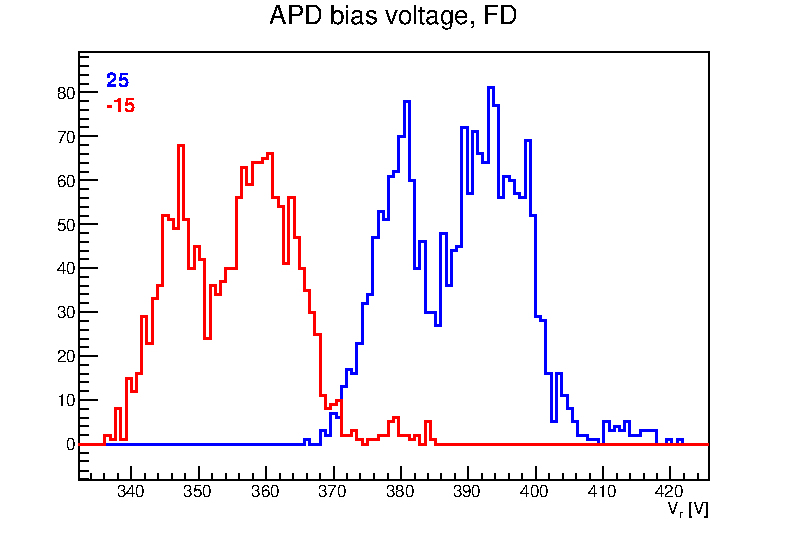
QAGui
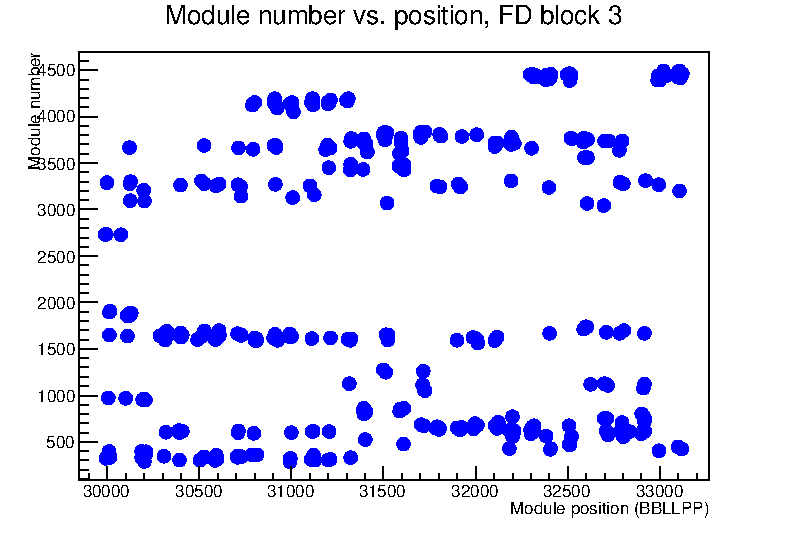
QAGui is a Python GUI tool which provides an easy access to QA database data. Currently contains only FarDet. It serves as an easy to use interface to QA database which :
- visualize a logical structure of NOvA detector (currently only FarDet)
- provide desired QA data in a graphical form (ROOT histograms)
- provide desired QA data in a text form for use by other programs.
|
|